CPU Perf Issues (photogrammetry/julie) #7400
Labels
Comments
|
Is this using combined Cesium or modules? Are these numbers with debug code removed? (i.e. We should always profile with |
|
I'll re-check with combineRelease |
|
Same relative bottlenecks and existing images are still representative (and colored, combine release's aren't) so I'll keep them as is. Combing through it looks like times are similar if not the same. |
Sign up for free
to join this conversation on GitHub.
Already have an account?
Sign in to comment
Just documenting current CPU perf issues in cesium (photogrammetry/julie).
representative of
combineRelease.Biggest and most consistent bottleneck: gl.texImage2D -> imageDecode. The only way to shorten it within in a frame is to texSubImage2D (upload images a chunk at a time) but this will make scene loading much longer. createBitmapImage was created to offload some of the heavy work performed by texImage2D in an async manner so that the blocking texImage2D won't take so long. All of this according to:
https://stackoverflow.com/questions/51710067/webgl-async-operations
Original attempt to solve using createBitmapImage: #6624
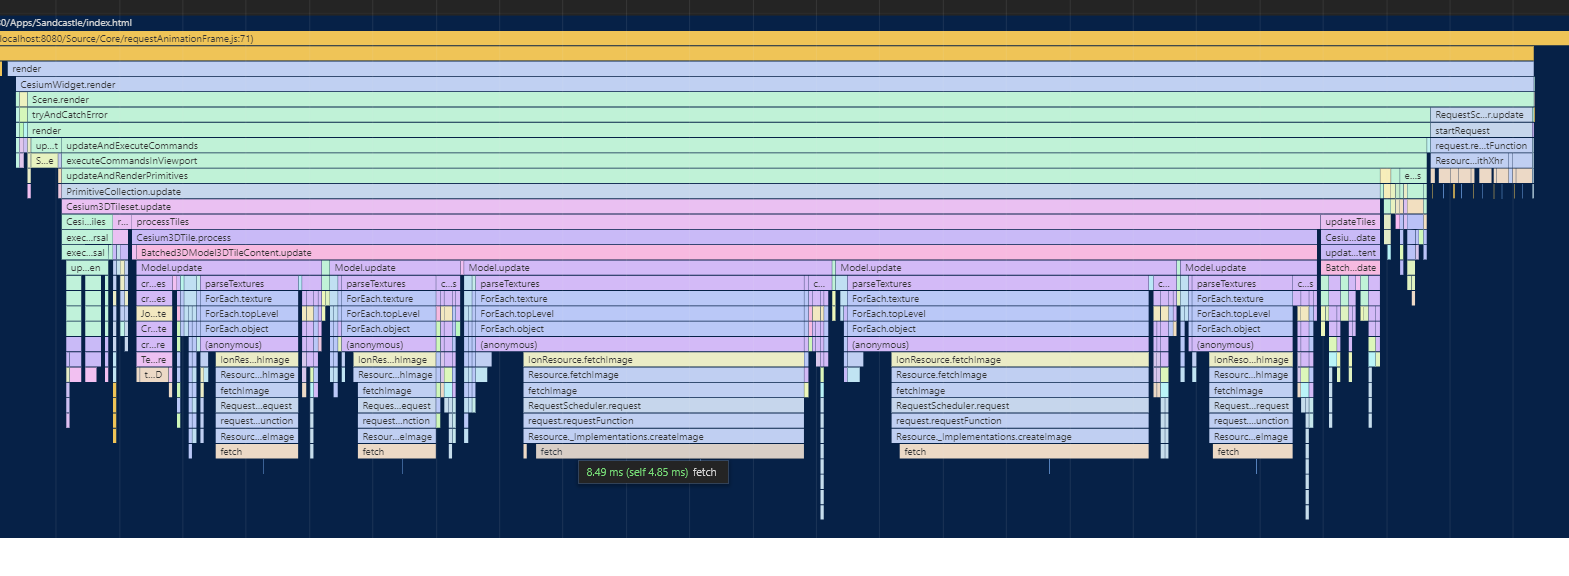
If multiple createBitmapImage calls can be done in parallel would need to promisify further up the call stack (model.update within batched3dmodel3dtilecontent.update?).
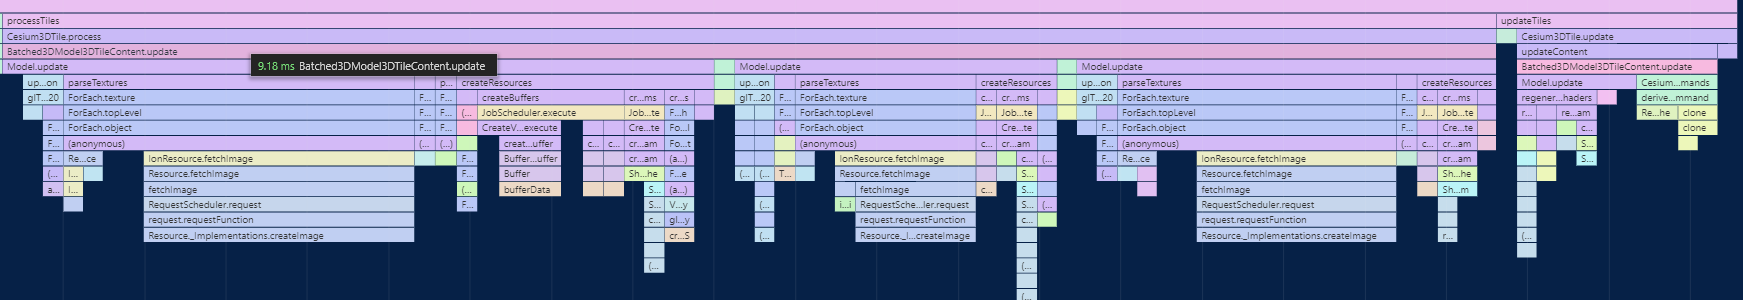
createImageBitmap vs not. Red bars are the chrome profilers way of indicating that there's a really low fps at that point.

Related to above, model updates in a batched model update. Possible to promisify in any way?
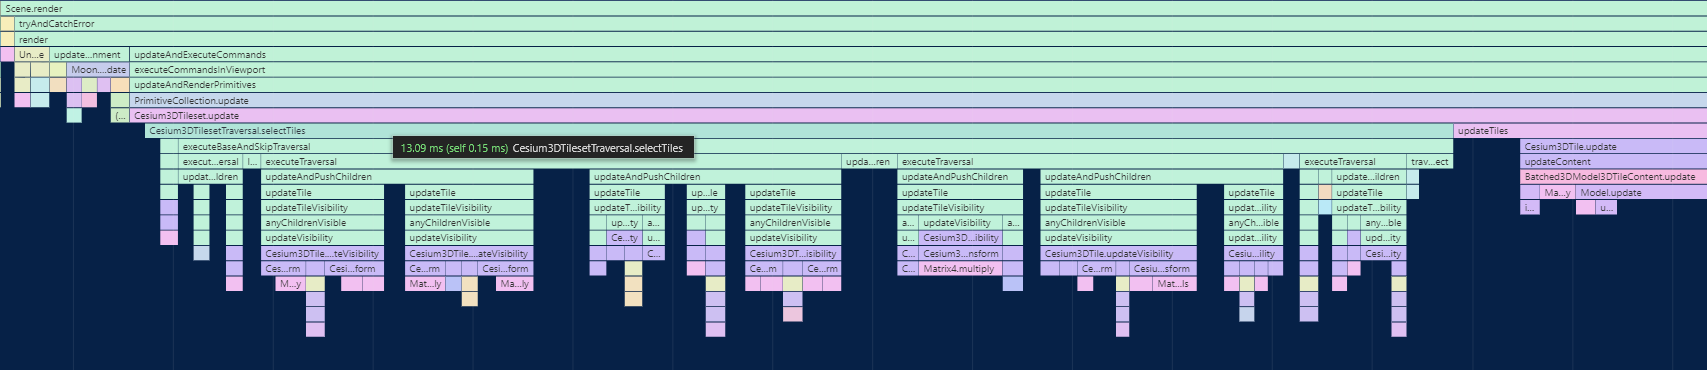
Traversal time consistently dominated by updateVisibility. Ex:
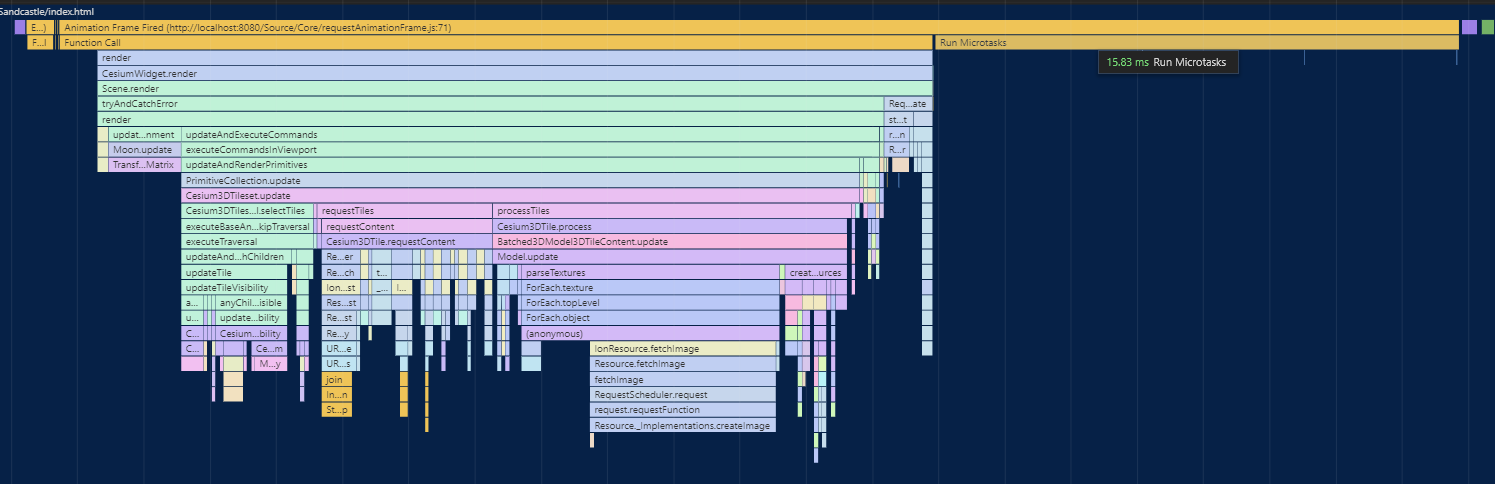
'Run microtasks' taking up this much time is surprisingly (or unsurprisingly?) common.
Misc:
RequestScheduler.getServerKey chews up most of the time in RequestScheduler.request
The text was updated successfully, but these errors were encountered: