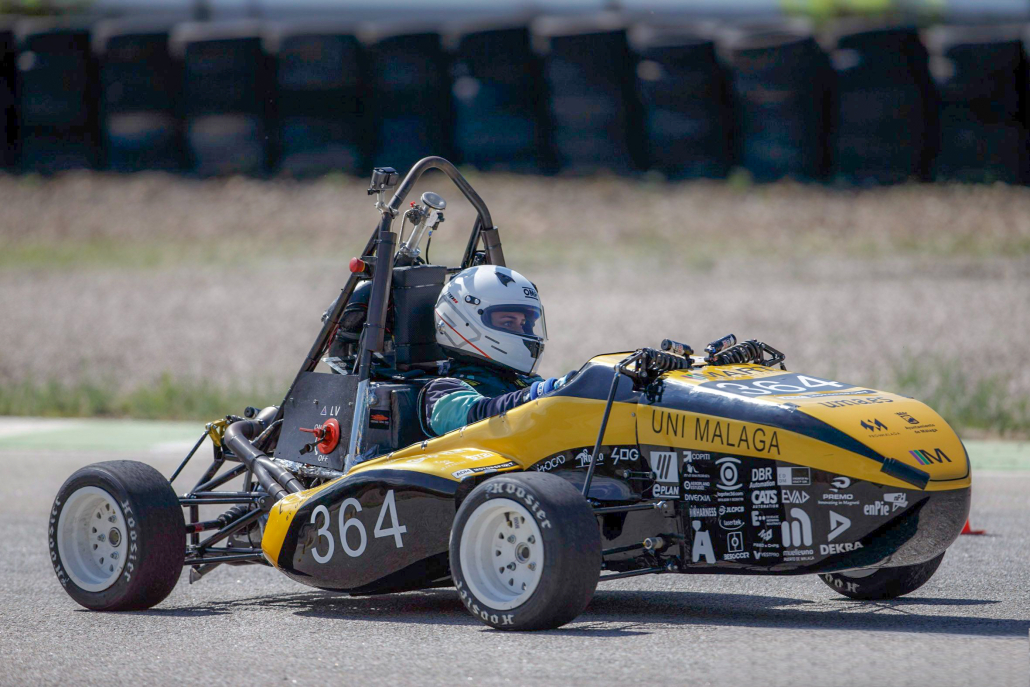
🇬🇧 Formula Student is a motor racing competition between students from universities around the world, promotes excellence in engineering so that each team designs and manufactures a single-seater which then competes.
The MART Formula Student team, from the University of Malaga, competed in the 2022 season in Formula Student Spain, finishing in third position (P3) in endurance, a test that consists of a circuit in which the endurance of the formula is demonstrated to complete 22km. There is a mandatory stop at 11km to make a driver change, turning off the engine and restarting it, testing the reliability of the car to the limit. Therefore, we have a driver A and a driver B running in the same conditions.
From the data obtained from this test we proceed to analyze the behavior of pilot A and pilot B in the first lap. This analysis determines speed averages, maximum and minimum values and other variables clarifying significant data of both drivers.
🇪🇸 Formula Student es una competición automovilística entre estudiantes de universidades de todo el mundo, promueve la excelencia en ingeniería de forma que, cada equipo diseña y fabrica un monoplaza el cual posteriormente compite.
El equipo MART Formula Student, de la Universidad de Málaga compitió en la temporada 2022 en Formula Student Spain quedando en tercera posición (P3) en endurance, una prueba que consiste en un circuito en el cual se demuestra la resistencia del formula hasta completar 22km. Se lleva a cabo una parada obligatoria a los 11Km para realizar un cambio de piloto, apagando el motor y volviéndolo a arrancar, poniendo a prueba la fiabilidad del monoplaza al límite. Por lo tanto, tenemos un piloto A y un piloto B que corren en mismas condiciones.
A partir de los datos obtenidos de esta prueba se procede a analizar el comportamiento del piloto A y el piloto B en la primera vuelta. Este análisis determina medias de velocidad, valores máximos, mínimos y otras variables esclareciendo datos significativos de ambos pilotos.
⚙️ Install Folium
⚙️ Install Power BI
⚙️ Import matplotlib.pyplot as plt
⚙️ Import pandas as pd
⚙️ Import numpy as np
🏎 Data extraction
The data were extracted from the MA22RT single-seater during the Formula Student Spain endurance in the 2021/2022 season. Subsequently they were visualized in the software #RaceStudio3 by which the data were converted to CSV format and split into file by laps (in different CSV).
🧹 Cleaning and scanning
Data cleaning was carried out in #Python ensuring the absence of null values, duplicates and checking that the column names.
With the exploration of the data the objective was to determine significant differences between pilot A and pilot B.
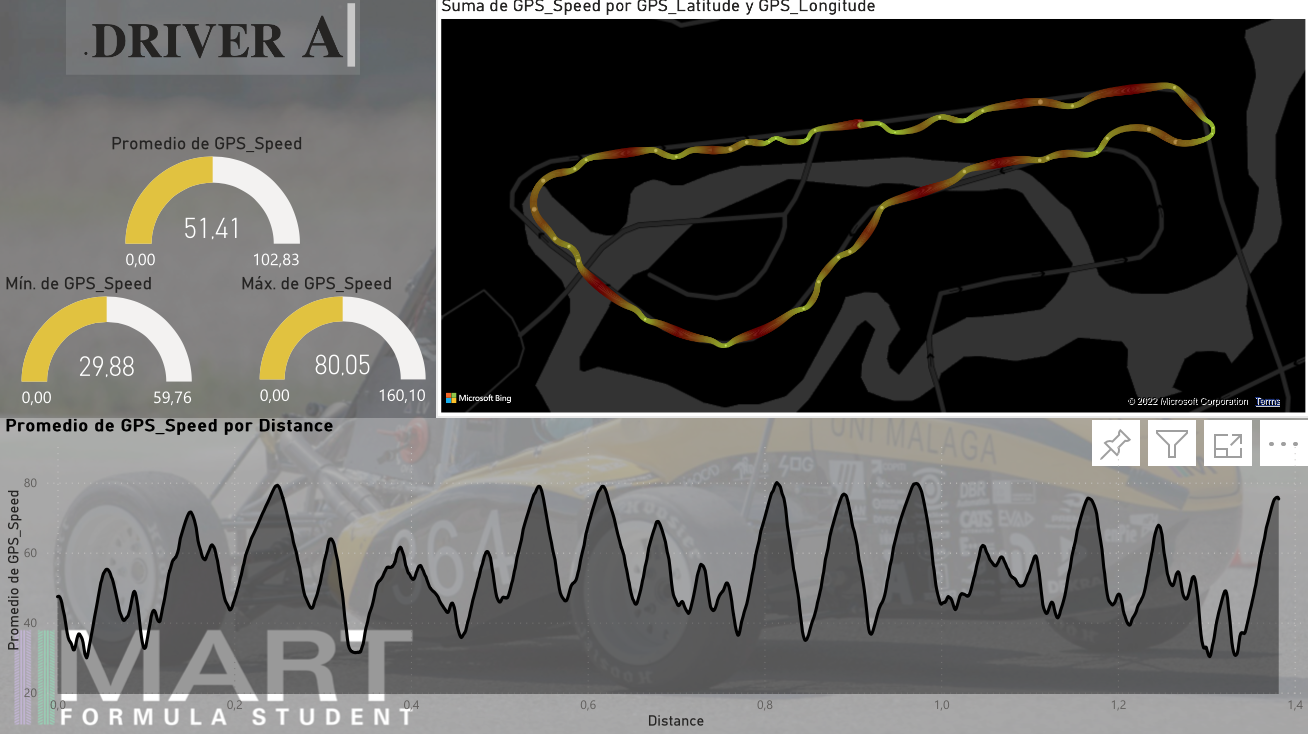
The visualization has been carried out in #Powerbi by which is drawn:
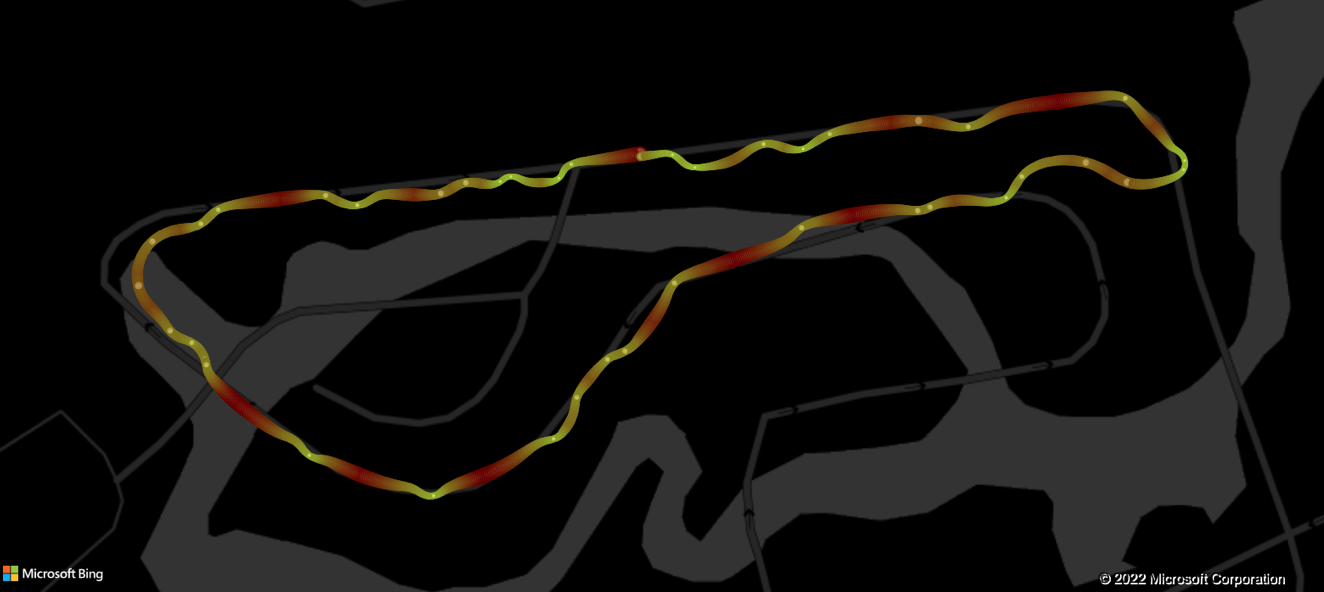
🏁 The circuit run: Its layout has been carried out by capturing the longitude and latitude data collected.
💨 Single-seater speed: The speed is shown both in the circuit, with the sections where the speed has been higher in reddish tones, while where the speed values are lower, greenish values are shown.
⚡️ Maximum, minimum, average speed This is represented in KPI format
🔥 Graphs: Additional and specific speed information can be found in the graphs.
🏁 Traveled circuit: Made with the longitude and latitude data collected by the single-seater. The reddish traces show the formula's acceleration zones while the green ones show the deceleration zones.
🌪 Single-seater acceleration: The acceleration of the single-seater on the x-axis where the deceleration moments can be clearly observed.
💨 Maximum and minimum acceleration Represented in KPI format.
🔥 Graphs: By means of the graphs the deceleration moments of the single-seater can be carefully observed.
✨ Average Acceleration: 0.00582
✨ Minimum acceleration: 0.68876
✨ Maximum acceleration: -0.91584
⭐️ Average speed: 51.4138 km/h
⭐️ Minimum speed: 29.881001 km/h
⭐️ Maximum speed: 80.050499 km/h
⭐️ Total time 1st lap: 48.3999 Km/h
✨ Average acceleration: 0.011080
✨ Minimum acceleration: -0.980421
✨ Maximum acceleration: 0.714044
⭐️ Average speed: 53.38404033 km/h
⭐️ Minimum speed: 29.028 km/h
⭐️ Maximum speed: 86.168 km/h
⭐️ Total time 1st lap: 46.6999 Km/h


